Working with Formulas
Contents
[
Hide
]
Introduction
The value of a chart data point can be calculated based on a formula. Formulas can be specified for values, x-values, y-values, and bubble sizes. You can use formulas in the case when an Excel workbook is used as the data source.
The code examples below use the CreateShape method described in Add a Shape to a Slide.
Examples
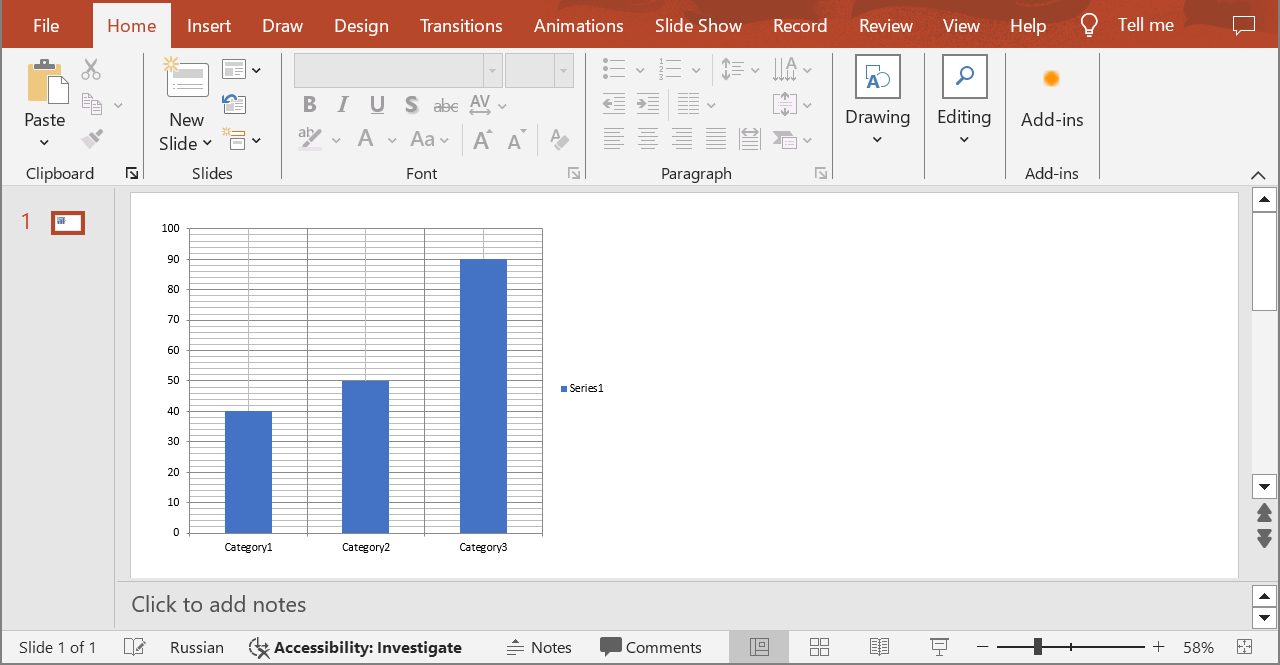
The code examples below show how to use the formula for calculating the value of the third data point in the first data series when creating a chart. The formula looks like SUM(B2:B3). It means that the third data point value is the sum of the first two data point values.
cURL Example
SDK Examples
SDK Solutions
The result:
SDKs
Check Available SDKs to learn how to add an SDK to your project.